Dashboards
Harvest can be used to import dashboards to Grafana.
The bin/harvest grafana utility requires the address (hostname or IP), port of the Grafana server,
and a Grafana API token. The port can be omitted if Grafana is configured to redirect the URL. Use the -d flag to
point to the directory that contains the dashboards.
Grafana API token
The utility tool asks for an API token which can be generated from the Grafana web-gui.
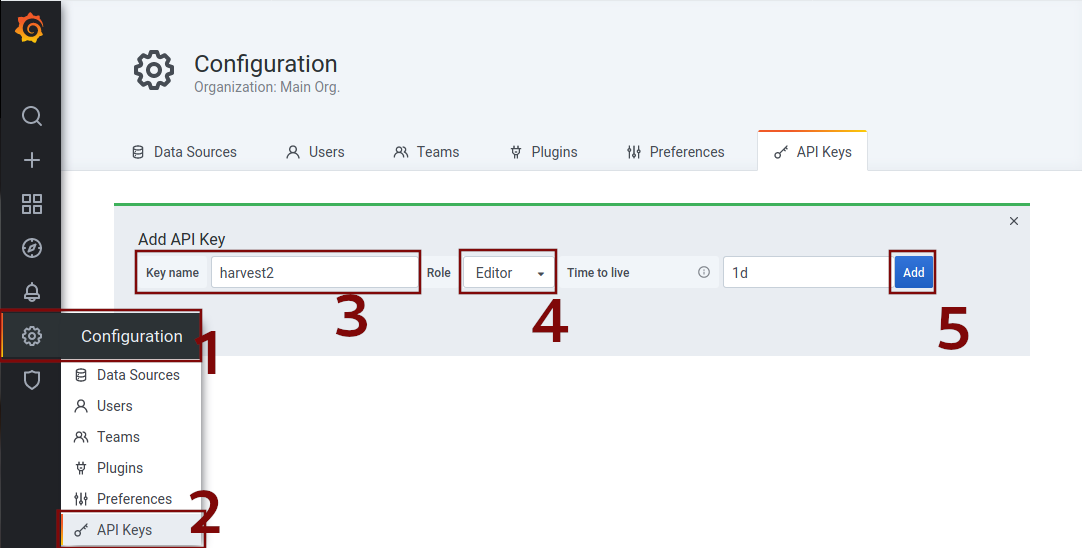
Click on Configuration in the left menu bar (1), click on API Keys (2) and click on the New API Key button. Choose
a Key name (3), choose Editor for role (4) and click on add (5). Copy the generated key and paste it in your terminal
or add the token to the Tools section of your configuration file. (see below)
For example, let's say your Grafana server is on http://my.grafana.server:3000 and you want to import the
Prometheus-based dashboards from the grafana directory. You would run this:
$ bin/harvest grafana import --addr my.grafana.server:3000
Similarly, to export:
$ bin/harvest grafana export --addr my.grafana.server:3000 --directory /path/to/export/directory --serverfolder grafanaFolderName
By default, the dashboards are connected to the Prometheus datasource defined in Grafana. If your datasource has a
different name, use the --datasource flag during import/export.