Checklists for Harvest
A set of steps to go through when something goes wrong.
What version of ONTAP do you have?
Run the following, replacing <poller> with the poller from your harvest.yaml
./bin/harvest zapi -p <poller> show system
Copy and paste the output into your issue. Here's an example:
./bin/harvest -p infinity show system
connected to infinity (NetApp Release 9.8P2: Tue Feb 16 03:49:46 UTC 2021)
[results]                             -                                   *
  [build-timestamp]                   -                          1613447386
  [is-clustered]                      -                                true
  [version]                           - NetApp Release 9.8P2: Tue Feb 16 03:49:46 UTC 2021
  [version-tuple]                     -                                   *
    [system-version-tuple]            -                                   *
      [generation]                    -                                   9
      [major]                         -                                   8
      [minor]                         -                                   0
Install fails
I tried to install and ...
How do I tell if Harvest is doing anything?
You believe Harvest is installed fine, but it's not working.
- Post the contents of your
harvest.yml
Try validating your harvest.yml with yamllint like so: yamllint -d relaxed harvest.yml
If you do not have yamllint installed, look here.
There should be no errors - warnings like the following are fine:
harvest.yml
  64:1      warning  too many blank lines (3 > 0)  (empty-lines)
-
How did you start Harvest?
-
What do you see in
/var/log/harvest/* -
What does
ps aux | grep pollershow? -
If you are using Prometheus, try hitting Harvest's Prometheus endpoint like so:
curl http://machine-this-is-running-harvest:prometheus-port-in-harvest-yaml/metrics
- Check file ownership (user/group) and file permissions of your templates, executable, etc in your Harvest home directory (
ls -la /opt/harvest/) See also.
How do I start Harvest in debug mode?
Use the --debug flag when starting a poller. In debug mode, the poller will only collect metrics, but not write to databases. Another useful flag is --foreground, in which case all log messages are written to the terminal. Note that you can only start one poller in foreground mode.
Finally, you can use --loglevel=1 or --verbose, if you want to see a lot of log messages. For even more, you can use --loglevel=0 or --trace.
Examples:
bin/harvest start $POLLER_NAME --foreground --debug --loglevel=0
or
bin/harvest start $POLLER_NAME --loglevel=1 --collectors Zapi --objects Qtree
How do I start Harvest in foreground mode?
See How do I start Harvest in debug mode?
How do I start my poller with only one collector?
Since a poller will start a large number of collectors (each collector-object pair is treated as a collector), it is often hard to find the issue you are looking for in the abundance of log messages. It might be therefore useful to start one single collector-object pair when troubleshooting. You can use the --collectors and --objects flags for that. For example, start only the ZapiPerf collector with the SystemNode object:
harvest start my_poller --collectors ZapiPerf --objects SystemNode
(To find to correct object name, check conf/COLLECTOR/default.yaml file of the collector).
Errors in the log file
Some of my clusters are not showing up in Grafana
The logs show these errors:
context deadline exceeded (Client.Timeout or context cancellation while reading body)

and then for each volume

skipped instance [9c90facd-3730-48f1-b55c-afacc35c6dbe]: not found in cache
Workarounds
context deadline exceeded (Client.Timeout or context cancellation while reading body)
means Harvest is timing out when talking to your cluster. This sometimes happens when you have a large number of resources (e.g. volumes).
There are a few parameters that you can change to avoid this from happening. You can do this by editing the subtemplate of the resource affected. E.g. you can add the parameters in conf/zapiperf/cdot/9.8.0/volume.yaml or conf/zapi/cdot/9.8.0/volume.yaml. If the errors happen for most of the resources, you can add them in the main template of the collector (conf/zapi/default.yaml or conf/zapiperf/default.yaml) to apply them on all objects.
client_timeout
Increase the client_timeout value by adding a client_timeout line at the beginning of the template, like so:
# increase the timeout to 60 seconds
client_timeout: 60s
batch_size
Decrease the batch_size value by adding a batch_size line at the beginning of the template. The default value of this parameter is 500. By decreasing it, the collector will fetch less instances during each API request. Example:
# decrease number of instances to 200 for each API request
batch_size: 200
schedule
If nothing else helps, you can increase the data poll interval of the collector (default is 60s for ZapiPerf and 180s for Zapi). You can do this either by adding a schedule attribute to the template or, if it already exists, by changing the - data line.
Example for ZapiPerf:
# increase data poll frequency to 2 minutes
schedule:
  - counter: 1200s
  - instance: 600s
  - data: 120s
# increase data poll frequency to 5 minutes
schedule:
  - instance: 600s
  - data: 300s
Prometheus HTTP Service Discovery doesn't work
Some things to check:
- Make sure the Harvest admin node is started via
bin/harvest admin startand there are no errors printed to the console - Make sure your
harvest.ymlincludes a validAdmin:section - Ensure
bin/harvest doctorruns without error. If it does, include the output ofbin/harvest doctor --printin Slack or your GitHub issue - Ensure your
/etc/prometheus/prometheus.ymlhas a scrape config withhttp_sd_configsand it points to the admin node'sip:port - Ensure there are no errors in your poller logs (
/var/log/harvest) related to the poller publishing its Prometheus port to the admin node. Something like this should help narrow it down:grep -R -E "error.*poller.go" /var/log/harvest/- If you see errors like
dial udp 1.1.1.1:80: connect: network is unreachable, make sure your machine has a default route setup for your main interface
- If you see errors like
- If the admin node is running, your
harvest.ymlincludes theAdmin:section, and your pollers are using the Prometheus exporter you should be able to curl the admin node endpoint for a list of running Harvest pollers like this:curl -s -k https://localhost:8887/api/v1/sd | jq . [ { "targets": [ ":12994" ], "labels": { "__meta_poller": "F2240-127-26" } }, { "targets": [ ":39000" ], "labels": { "__meta_poller": "simple1" } } ]
How do I run Harvest commands in NAbox?
NAbox is a vApp running Alpine Linux and Docker. NAbox runs Harvest as a set of Docker containers. That means to execute Harvest commands on NAbox, you need to exec into the container by following these commands.
-
Start bash in the Harvest container
dc exec nabox-harvest2 bash
You should see no errors and your prompt will change to something like root@nabox-harvest2:/app#
Below are examples of running Harvest commands against a cluster named umeng-aff300-05-06. Replace with your cluster name as appropriate.
# inside container

> cat /etc/issue
Debian GNU/Linux 10 \n \l

> cd /netapp-harvest
bin/harvest version
harvest version 22.08.0-1 (commit 93db10a) (build date 2022-08-19T09:10:05-0400) linux/amd64
checking GitHub for latest... you have the latest ✓

# harvest.yml is found at /conf/harvest.yml

> bin/zapi --poller umeng-aff300-05-06 show system
connected to umeng-aff300-05-06 (NetApp Release 9.9.1P9X3: Tue Apr 19 19:05:24 UTC 2022)
[results]                                          -                                   *
  [build-timestamp]                                -                          1650395124
  [is-clustered]                                   -                                true
  [version]                                        - NetApp Release 9.9.1P9X3: Tue Apr 19 19:05:24 UTC 2022
  [version-tuple]                                  -                                   *
    [system-version-tuple]                         -                                   *
      [generation]                                 -                                   9
      [major]                                      -                                   9
      [minor]                                      -                                   1

bin/zapi -p umeng-aff300-05-06 show data --api environment-sensors-get-iter --max 10000 > env-sensor.xml
The env-sensor.xml file will be written to the /opt/packages/harvest2 directory on the host.
If needed, you can scp that file off NAbox and share it with the Harvest team.
Rest Collector Auth errors?
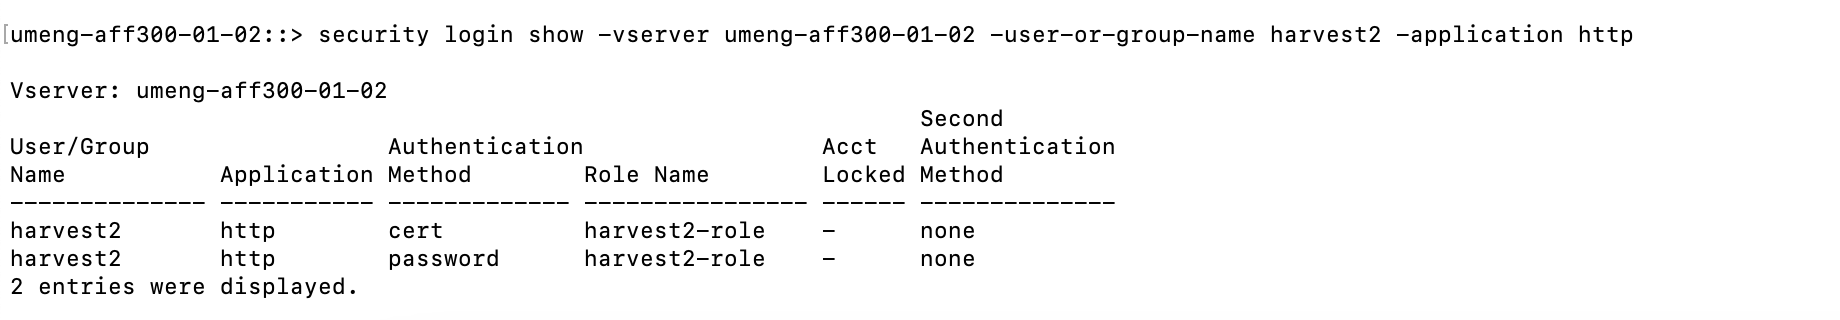
If you are seeing errors like User is not authorized or not authorized for that command while using Rest Collector. Follow below steps to make sure permissions are set correctly.
- Verify that user has permissions for relevant authentication method.
security login show -vserver ROOT_VSERVER -user-or-group-name harvest2 -application http
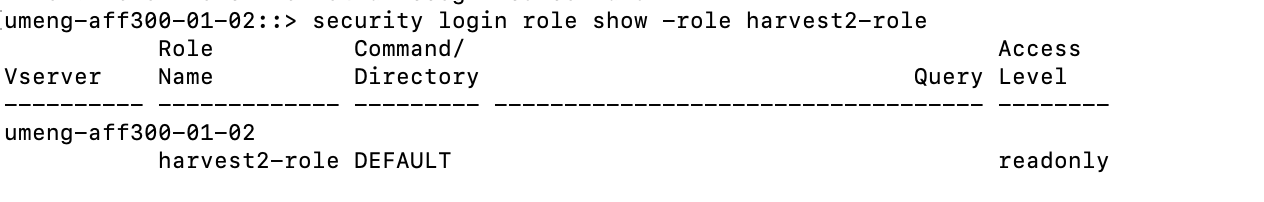
- Verify that user has read-only permissions to api.
security login role show -role harvest2-role
- Verify if an entry is present for following command.
vserver services web access show -role harvest2-role -name rest
If It is missing then add an entry with following commands
vserver services web access create -vserver umeng-aff300-01-02 -name rest -role harvest2-role
Why do I have gaps in my dashboards?
Here are possible reasons and things to check:
- Prometheus
scrape_intervalfound via (http://$promIP:9090/config) - Prometheus log files
- Harvest collector scrape interval check your:
conf/zapi/default.yaml- default for config is 3mconf/zapiperf/default.yaml- default of perf is 1m
- Check you poller logs for any errors or lag messages
- When using VictoriaMetrics, make sure your Prometheus exporter config includes
sort_labels: true, since VictoriaMetrics will mark series stale if the label order changes between polls.
NABox
For NABox installations, refer to the NABox documentation on troubleshooting: