Dashboards
Harvest can be used to import dashboards to Grafana.
The bin/harvest grafana utility requires the address (hostname or IP), port of the Grafana server,
and a Grafana API token. The port can be omitted if Grafana is configured to redirect the URL. Use the -d flag to
point to the directory that contains the dashboards.
Grafana API token
The utility tool asks for an API token which can be generated from the Grafana web-gui.
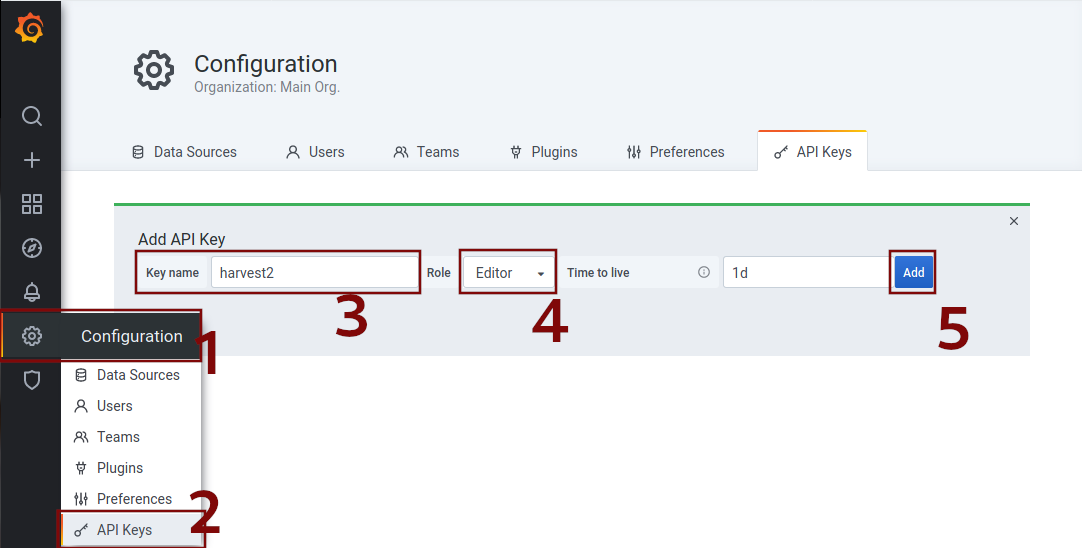
Click on Configuration in the left menu bar (1), click on API Keys (2) and click on the New API Key button. Choose
a Key name (3), choose Editor for role (4) and click on add (5). Copy the generated key and paste it in your terminal
or add the token to the Tools section of your configuration file. (see below)
For example, let's say your Grafana server is on http://my.grafana.server:3000 and you want to import the
Prometheus-based dashboards from the grafana directory. You would run this:
bin/harvest grafana import --addr my.grafana.server:3000
Similarly, to export:
bin/harvest grafana export --addr my.grafana.server:3000 --directory /path/to/export/directory --serverfolder grafanaFolderName
By default, the dashboards are connected to a datasource named prometheus (case-sensitive).
This is a datasource of the Prometheus type, defined in Grafana.
However, despite the type, the datasource can have any name.
If you have a Prometheus type datasource with a name different from prometheus,
you can specify this name using the --datasource flag during import/export like this:
bin/harvest grafana import --addr my.grafana.server:3000 --datasource custom_datasource_name
CLI
The bin/harvest grafana tool includes CLI help when passing the --help command line argument flag like so:
bin/harvest grafana import --help
The labels argument requires more explanation.
Labels
The grafana import --labels argument goes hand-in-hand with a poller's Labels section described here.
Labels are used to add additional key-value pairs to a poller's metrics.
When you run bin/harvest grafana import, you may optionally pass a set of labels like so:
bin/harvest grafana import --labels org --labels dept
This will cause Harvest to do the following for each dashboard: 1. Parse each dashboard and add a new variable for each label passed on the command line 2. Modify each dashboard variable to use the new label variable(s) in a chained query.
Here's an example:
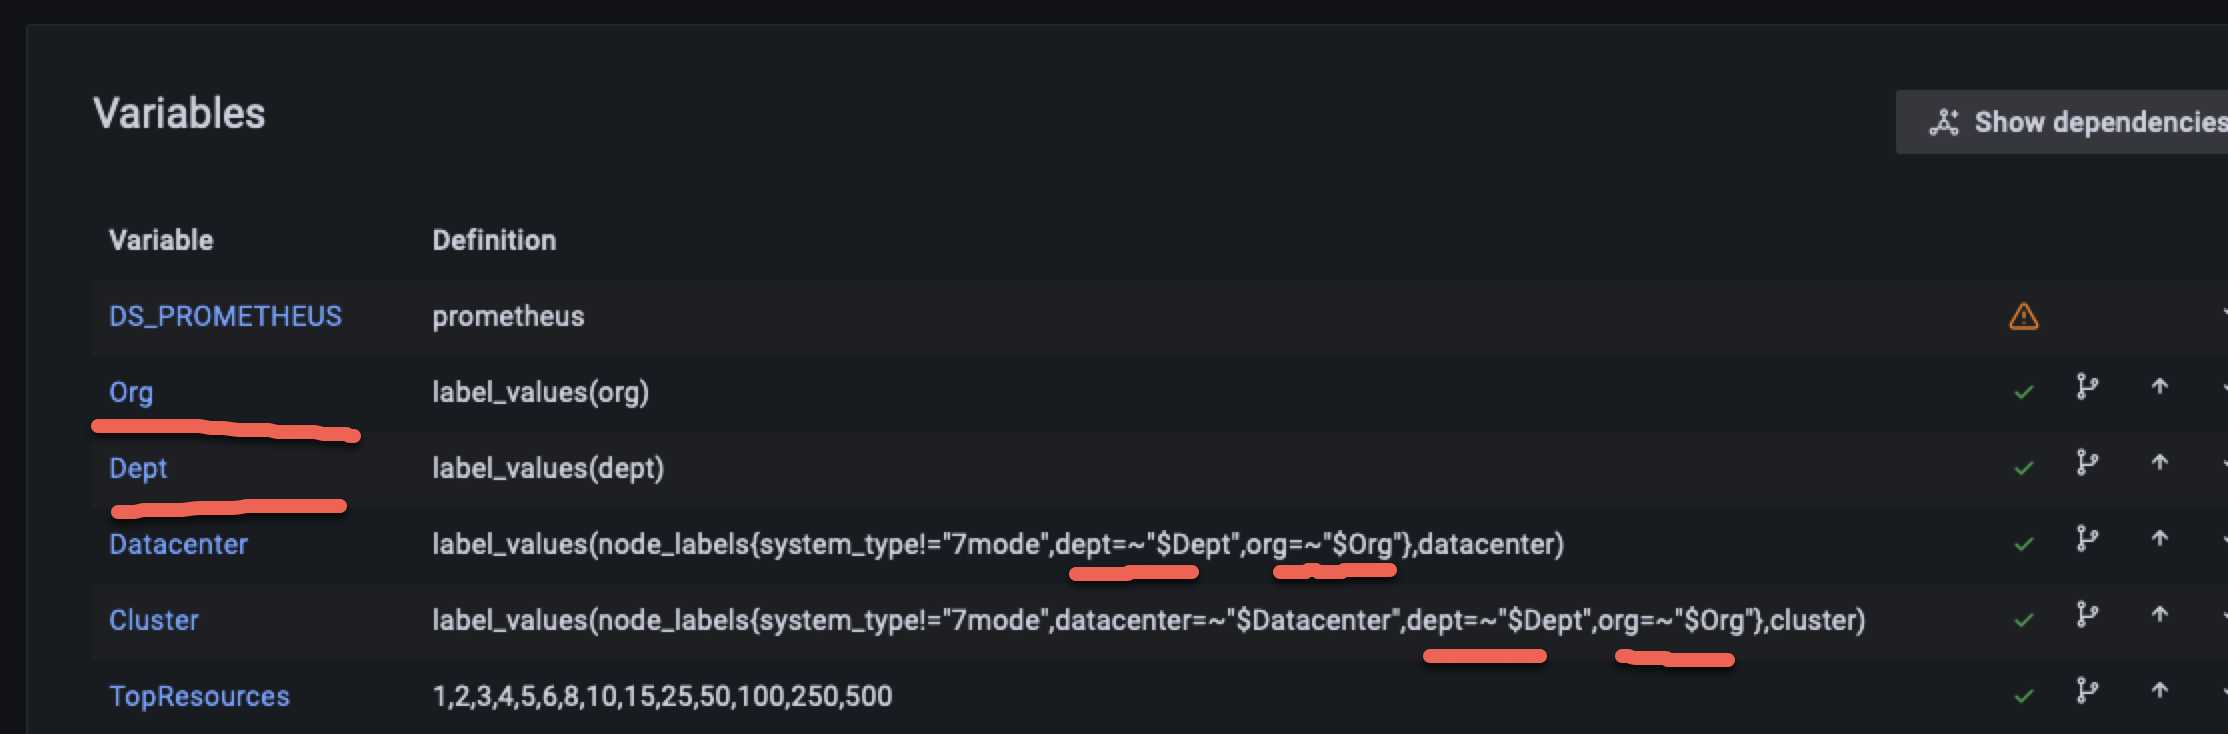
bin/harvest grafana import --labels "org,dept"
This will add the Org and Dept variables, as shown below, and modify the existing variables as shown.
Results in
Creating a Custom Grafana Dashboard with Harvest Metrics Stored in Prometheus
This guide assumes that you have already installed and configured Harvest, Prometheus, and Grafana. Instead of creating a new Grafana dashboard from scratch, you might find it more efficient to clone and modify an existing one. Alternatively, you can copy/paste an existing dashboard's panel from an existing dashboard into your new one.
Harvest collects a wide range of metrics from ONTAP, StorageGRID, E-Series, Cisco Nexus Switches and Arista Switches. These metrics can be used to create dashboards in Grafana.
Step 1: Confirm that Prometheus is Receiving Metrics from Harvest
Before creating a dashboard, make sure the relevant metric is present via a PromQL query in the Prometheus UI. If the metric is not present, navigate to Status -> Targets in the Prometheus UI to check the state and any potential errors of the scrape target.
Step 2: Add Prometheus as a Data Source in Grafana
If you haven't already, add Prometheus as a data source in Grafana:
- In the Grafana UI, go to
Configuration > Data Sources. - Click
Add data source. - Select
Prometheus. - Enter the URL of your Prometheus server, and click
Save & Test.
Step 3: Create a New Dashboard
Now you're ready to create a new dashboard:
- In the Grafana UI, click the
+icon on the left menu and selectDashboard. - Click
Add new panel.
Step 4: Add Queries to Visualize Harvest Metrics
In the new panel, you can add queries to visualize the Harvest metrics:
- In the query editor, select
Prometheusas the data source. - Write your query to visualize the Harvest counters. Prometheus uses a language called PromQL for querying data. The exact query will depend on the specific Harvest counters you want to visualize. You can refer to the Harvest metrics documentation for details on the available metrics.
- Adjust the visualization settings as needed, and click
Applyto add the panel to the dashboard.
Step 5: Save the Dashboard
Once you're satisfied with the panels and layout of your dashboard, don't forget to save it. You can then share it with others, or keep it for your own use.
Remember, the specifics of these steps can vary depending on your exact setup and requirements. This guide provides a general approach, but you may need to adjust it for your situation.